|
|
| |
T.E.I. of
PRINCIPLES OF ECONOMIC POLICY
Erasmus Student from Italy
Università degli studi di Roma "Tor Vergata" (Economia)
Department: ACCOUNTING
Work number 2
QUESTION n° 1
The invisible hand principle, (by A Smith), affirm that: in a market in perfect competition
each individual is use to follow his own self-interest, but in the same time he is conduct by a kind of "invisible hand", in this way the individual is led to follow the interests of the community.
This economic property is valid if the market is in perfect competition. In the contrary if the market is in: monopolistic competition, imperfect competitive the invisible hand property is invalid; in this case it is necessary a intervention of the state.
So in this conditions the market do not produce the maximum amount of goods with them own resources.
QUESTION n° 2
To represent a schedule of supply we can do reference at the relationship between quantity supply and price of a good, in the same time we have to consider productions costs, price of related goods, government policy; be stationary.
Among determinants of the supply of pizza we can list: 1) productions costs (if productions costs are cheaper than market prices it is expedient to increase the production), 2) input prices and technology's progress, 3) prices of related goods (if prices of trucks grow, the supply of cars falls), 4) government policy, 5) special influences (if government lowers standards on pollution-control equipment, supply of pizza may increase)
- Supply curve for pizza Relate Quantity Supplied to Price
|
|
PRICE(Euro per Pizza) |
QUANTITY SUPPLIED(millions of Pizza per year) |
|
A |
|
|
|
B |
|
|
|
C |
|
|
|
D |
|
|
|
E |
|
|
- Supply changes when any influences other than the commodity's price changes.
When pizza prices change, producers change their production and quantity supplied, but the supply and the supply curve do not shift. By contrast, when other influences affecting supply change, supply change and the supply curve shift.
For example supply would increase if the introduction of cost-saving computerized design and manufacturing reduced the labour required, if the power of competitors increase, if the government removed some of the regulatory requirements on the industry. Any of these element would increase the supply of pizza.
A change of price of pizza do not cause a shift of the supply curve but a movement along the supply curve (the supply of pizza goes up in response to a price rise). When the supply of pizza goes up because the price of meal has dropped, that's a shift of the supply curve.
QUESTION n° 3
In a competitive market the balance between demand and supply is given by a level price at which the strength of demand and supply are equal. The Balance price is given when the quantity of demand and the quantity of supply are the same.
The balance point is situated (in the graph) where the supply curve and the demand curve meets.
If the price of a good exceed the balance price, firms wish to produce more quantity than customers needs.(wants to buy). So we have an increase of supply and a decrease in price, while whit a low price we have an increase in demand. So the customer's behavior leads an increase in price towards (in direction of) balance point.
When supply curve or demand curve shift we have changes in price and quantity.
If demand increase, the demand curve shift towards right, and we have an increase in price and quantity.
With an increase of supply the supply curve shift towards right and we have an increase in quantity and a decrease in price.
If the price of hamburgers fall, probably it happens for one (or both) of the following reasons:
The demand level of hamburgers is falls so the price of hamburgers falls too.
When a demand of a good (like hamburgers) falls the demand curve shift (v/s) left.
As we can see the price decrease and the quantity decrease as well.
2) The supply level of hamburgers has grown, so the price level of hamburgers falls.
When supply of a good (like hamburgers) grows, the supply curve shift (v/s) right.
As we can see the price decrease and the quantity rise
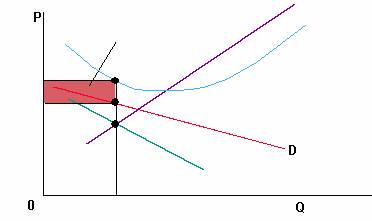
I think that PIZZA and HAMBURGERS are substitutes goods.
We can try to explain this concept in the following way: if pizza is good (A) and hamburgers are goods (B), A and B are substitutes goods if an increase in price of goods A leads to an increase of demand of the substitute good B.
So it is probable that if the price of hamburgers falls customers decides to reduce the purchase of pizza, in this case the demand curve of pizza shift towards left
.We can see this in the figure below.
This situation happens because Hamburgers is a substitute goods of pizza.
In fact we assume that goods like pizza and hamburger has an elasticity level enough high. (otherwise than goods difficult to replace like electricity power).
Infect we can pay carefully attention to the cross-elasticity of demand ( the cross-price elasticity of demand), it tells us the effect on the quantity demanded of the goods (A) if the price of another good, good (B), is changed. The cross price elasticity of demand for good (A) with respect to changes in the price of good (B) is the percentage in the quantity of good (A) demanded, divided by the correspondent percentage change in the price of good (B).The cross elasticity may be positive or negative. It is positive is a rise in the price of good (B) increase the quantity demanded of good (A). And in my opinion this is the situation of pizza and hamburgers, so WHEN THE PRICE OF HAMBURGERS FALLS THE DEMAND OF PIZZA FALLS AS WELL.
If demand of pizza decrease we will have a shift of demand curve towards left,
We can see this in the figure below.
In the same time price decrease and quantity decrease too.
QUESTION n° 4
The price elasticity of demand measures how much the quantity demanded of goods changes when the prices changes.
Goods vary enormously in their price elasticity ( or sensitivity to price changes).When the price elasticity of a goods is high, we say that the good has "elastic" demand, which means that its quantity demanded responds greatly to price changes. When the price elasticity of a goose is low, it is "inelastic" and its quantity demanded responds little to price changes. For necessities like food, fuel and shoes demand tends to be inelastic, cause them cannot easily be forgone when their price rise. By contrast you can substitute other goods when luxuries like ski vacations or 17-yeasr- old Scotch whiskey if price rise.
So When a 1 percent in price calls forth more than a 1 percent change in quantity demanded, this is Price-Elastic demand.
When a 1 percent change in price evokes less than a 1 percent change in quantity demanded, this is Price- inelastic demand.
One important special case is Unit-elastic demand, which occurs when the percentage change in quantity is exactly the same size as the percentage change in price.
Price Elasticity of Demand Falls into three Categories:
Elastic demand Unit-Elastic demand Inelastic demand
The notion of price elasticity is useful for analyzing supply and demand. One important application of elasticity is to help clarify whether a price increase will raise or lower revenues.
Total revenues is by definition equal to prices times quantity (P x Q). if you know the price elasticity of demand, than you know what will happen to total revenue when price changes.
When demand is inelastic an increase in price give us an increase of total revenue.
This happens because in this case the increase of price evokes less change in quantity demanded.
Ex
Situation 1.
P = Price P= 10 Euro
Q= Quantity demanded Q = 100 Kg
Total Revenue = 10 * 100 = 1000 Euro
Situation 2.
Now the price increase of 50% but the quantity demanded decrease les than 50 %, ( 75 Kg represent a decrees of 25 %). So:
P = Price P = 15 Euro
Q = Quantity demanded Q = 75 Kg
Total revenue = 15 * 75 = 1125 Euro
As we can see when demand is inelastic an increase in price give an increase of total revenue
We can say that free market allow price to be determinate by the forces of supply and demand. Market will be no free when effective control price exists
Price control are government rules or low that forbid the adjustment of price to checkmarket.
One kind of price control may be "FLOOR PRICE". (minimum price).
The aim of floor price is to rise the price for producers or suppliers.
One example of floor price is a national minimum wage rate per hour which rise the wage rate received by supply of labor.
The figure 5.1 shows us the demand curve and supply curve for labor. At higher wage rate, buyers of labor (firms)demand belabour but suppliers of labor ( workers) wish to sell more labor.
The free market equilibrium is at the point "E", where the wage rate is Wo. A minimum wage rate below Wo will be irrelevant since the free market equilibrium can still be attained.
Suppose in a effort to help workers the government impose a minimum wage rate at W1. Firms will demand the quantity Q1 and there will be excess supply AB.
The lucky workers who manage to sell as much labor as they wish will be better off than before, but some workers may be worse off since total number of hours worked fallen from Q0 to Q1.
At high wage rates firms demand less labor, but, suppliers of labor whish to sell more labor.
In spite we generally think that higher wage rate are necessary to fight the poverty , some researches shows us that an high minimum wage rate damage (who would like to help) because reduce number of labor place despoiled. So "Price floor" lead to a surplus of supply of labor (excess of supply).
The characteristic of competitive market are the following:
Many firms, each trivial relative to the industry as a whole.
A standardized or homogeneous product, so that it is legitimate to examine the industry as a whole rather than a series of sub-industries each with many fewer firms.
Perfect costumer information about the product quality so that buyers recognize that the identical products of different firms really are the same.
Free entry and exit so there is no incentive for existing firm to collude.
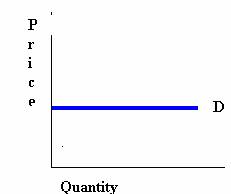
(Fig.6.1)
Firm in a perfectly competitive industry face a flat or horizontal demand as shown in the figure
Now we know which are the characteristics of a competitive market so we can say that:
Between the market of cola and beer, the second one is best to describe the competitive market because there are many different manufacturing-producers, the product is standardized, there is loftily costumer information and free entry and exit. In the contrary cola market is characterized by a few number of producers like" the coca cola company".
However in reality there is no one market that present precisely the perfect competition also if in our case beer is more representative of this kind of market then cola's market.
QUESTION n° 7
Monopoly is a kind of market in which is possible to find only one firm that supply a good , and this good only exists in this firm. The firm represents all the industry, and the demand curve of the industry has a negative angle. To sell more quantity of a good the firm needs to reduce the price. The price in a monopoly market is an important varying for decision making. However the monopolistic firm has not an unlimited market power because in the long run same other firms can enter in the market.
The monopolistic firm can gets an economical profit in the long run because the admission in the market is difficult by " barriers to entry".
We can also to say that monopoly is a particular case of imperfect competition, and most cases of imperfect competition can be traced to two principal causes. First, industries tend to have fewer sellers when there are significant economies of large-scale production and decreasing costs. In this situation large firms can simply produce more cheaply and then undersell small firms, which cannot survive. Second market tend to imperfect competition when it is difficult for new competitor to enter an industry. We have already talk about "barriers to entry" ( factor that make it hard for new firms to enter an industry. If barriers are high an industry may have an few number of firms.
One common type of barriers to entry are economies of scale, but we have others, including legal restrictions (government some times restrict competition using patents ,entry restrictions and foreign-trade tariffs and quotas), high cost of entry ( the price of entry may be very high), advertising and product differentiation ( advertising can create product awareness and loyalty to well-known brands, and product differentiation can impose a barrier to entry and increase the market power of producers)
We cam have different reasons that a market might have a monopoly:
A firm can control the entire supply of a raw material or to be in possession of particular kind of production factors. ( like a particular know how)
A firm can receive (by government ) the possibility to use exclusively a natural resources (for example the mining in a coal-mine)
A firm can have a patents to produce a good or to use a particular kind of productive process.
A firm can have a long run average costs very low and for others firms is not expedient to remain in the market.
One example of monopolistic market can be that one of electric power and gas. Considering Italian situation we can say that customer must buy this service by a unique firm (ENEL S.p.A.).
In this case we have a monopolistic situation above hall because it exists a kind of legal entry restriction (limitation), in fact is given,(by government), franchise monopoly to serve an area. The firm gets an exclusive right to provide a service and in return the firm agrees to limit its profit and provide services for customers.
We also have another example of monopolistic market when governments restrict competition with patents. A patent is granted to an inventor to allow temporary exclusive use (or monopoly) of the product or process that is patented. For example a pharmaceutical company may have a monopoly on a new drug for a precisely number of years because of patent protection. Governments grant patent monopolies to encourage inventive activity, without this protection a company or a sole inventor might be unwilling to devote the time and resources to research and development.
A specific example of this kind of monopoly is a pharmaceutical company " " that have the monopoly of the "Viagra".
To give another important example we can remember the SKY, with the cable Tv.
How is monopolistic competition like perfect competition:
Monopolistic competition envisages a larger number of quite small firms so that each firm can neglect the possibility that its own decision provoke any adjustment in others firms' behavior. We also assume free entry and exit from the industry in the long run. In this respects the framework resembles the perfect competitions' framework. What distinguishes monopolistic competition is that each firm faces a downward-sloping demand curve.
( As. Shown in the figure below number 8.1)
A: The perfectly competitive firm can sell all it wants along its horizontal dd curve without depressing the market price
B: But the imperfect competitor will find that its demand curve slopes downward as higher price d: rives sales down. And unless it is a sheltered monopolist, a cut in its rivals' prices will appreciably shift its own demand curve leftward to d'd'.
Monopolistic competition differs from perfect competition in that the products sold by different firm are not identical. Because companies sell slightly different products, they can slat slightly different prices.
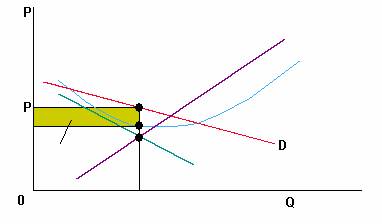
![]() We also have others two important differences
between perfect competition and monopolistic competition productive capacity in excess (excess
capacity): like monopolist CM = RM; but in the long run with P =
CMeT (not in the lowest point),
We also have others two important differences
between perfect competition and monopolistic competition productive capacity in excess (excess
capacity): like monopolist CM = RM; but in the long run with P =
CMeT (not in the lowest point),
![]() increase on
marginal cost (mark up) for the connection P > RM = CM.
increase on
marginal cost (mark up) for the connection P > RM = CM.
In perfect competition (in the long run) each firm is (dimensioned) on average medium cost, in monopolistic competition output is lesser than output in perfect competition.
We can see the figures in the next page:
Monopolistic competition has not all positive low (property) of perfect competition, monopolistic competition Make ( determine) deadweight loss because P > CM.
The classic case of monopolistic competition is the retail gasoline market. Customer may go to the local Exxon station even though it charges slightly more because it s on your way to work, but if the price rise more customer will switch to a different station. So one important source of product differentiation comes from locations, for this reason most small retail establishments operate in monopolistically competitive market.
But product differentiation can also arise because of differences in quality, in features, or even in perception. Monopolistic competition requires not merely product differentiation, but also limited opportunities for economies of scale so there are a great many producers who can largely neglect their interdependence with any particular rival. Hence many of the best examples of monopolistic competition are service industries where economies of scale are small.
Under perfect competition firm does not care if another buyer shows up at the existing price. With price equal to marginal cost the firm is already selling as much as it wants. The theory of monopolistic competition yields interesting insights when there are many goods each of which is a close but not perfect substitute for the other.
How is monopolistic competition like monopoly
We can learn about an industry paying careful attention to its market structure, particularly the number and size of sellers, and how much of the market the largest sellers control.
Economists classify imperfectly competitive markets into tree different market structure.
One of those is Monopoly that represent the most extreme case of imperfection.: a single seller whit complete control over an industry. It is the only one producing in its industry, and there is not industry producing close substitute.
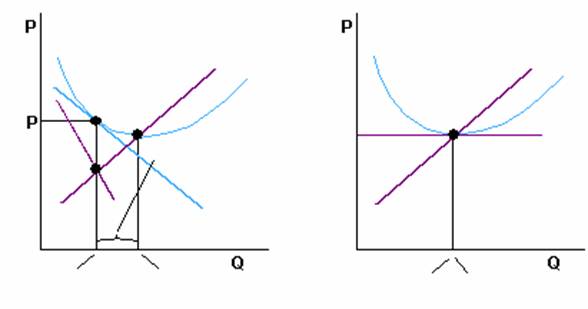
In the short run there is not difference between monopoly and monopolistic competition, in fact in the short run the behavior of each transector (businessman) (firm) of a monopolistic competition market is that standard of monopolist ( businessman).
The quantity is fixed at the value that determine RM = CM, the price is higher than average total cost ( but we also can have the opposite situation, so we have loss).
We can se the following Figures:
Which consequences can we have for this two situations?
(In the long run), in the first case (profits) new firms enters in the market, second case (loss) some firms leaves the market.
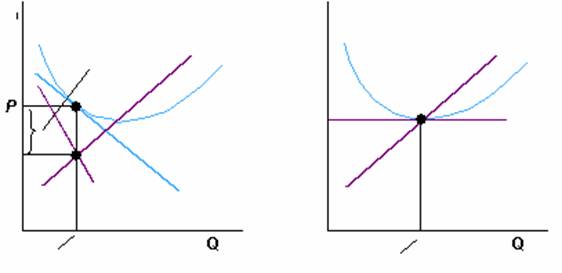
The number of firms change until profit became "0" ( zero). Figure:
Price exceed marginal cost, with marginal cost that equalize marginal revenue and a demanded curve decreases.
In monopolistic competition the regulation of prices, with the multiplicity of firms and products is impracticable( with more "acute" complexity than that of that natural monopoly).
And more; monopoly and perfect competition are both particular cases of imperfect competition, the first represent the limit case, the second is nearest at the perfect competition, is obviously possible that the market structure changes because the environment is changing.
QUESTION n°9
The market of local telephone service is the more representative of monopoly because the sellers have complete control over in industry. Here there is truly a single seller of a service with no close substites. However in the long run, no monopolists is completely secure from attack by competitors.
The market of copper is characterized to monopolistically competition where many producers sells goods similar with many real or perceived differences.
The producers compete on price, quality, and advertising infect the product differentiation come from differences in quality, in feature or even in perception
The last market of wooden pencils, is perfectly competitive infect the firms sells at market price, there is many firms, the product is standardized, there is loftily costumer information, and there is free entry and exit.
QUESTION n° 10
Is given the following table:
|
Combination |
Quantity of good X |
Quantity of good Y |
|
A |
|
|
|
B |
|
|
|
C |
|
|
|
D |
|
|
|
E |
|
|
|
F |
|
|
B) CHARACTERISTICS OF THE ABOVE "PPF" CURVE
The figure above shows us the possible combinations of good "X" and good "Y" that can be produced. At one extreme the economy can produce 40 units of good "Y" and 0 of good "X". At the other extreme, the economy can produce 15 units of good "X" but no good "Y". If we transfer factors of production from one industry to the other, the economy can produce more of one good, but only at the expense of producing less of the other good (there is a trade-off between good "X" and good "Y"). It the above figure we can see the maximum combinations of good "X" and "Y" that the economy can produce.
The point A corresponds to the first row of numbers in the table, where good "Y" is 40 unit and good "X" is zero.
The point B corresponds to the second row of numbers in the table, with 38 unit of good "Y" and 3 units of good "X". The points "C;D;E;F" corresponds to the last four rows of table. We can noticed that passing from point A to point B, C, D, E, F we have an increase of three (3) units of good "X", and a decrease of two (2) units of Y in B, 5 in C, 8 in D, 11 in E, 14 in F, (so per each point the decrease of units of the good Y has grow of three units).
The curve joining points A to F in figure above is called the " production possibility frontier".
The production possibility frontier shows, for each level of the output of one good, the maximum amount of the other good that can be produced. The way the frontier bends round and mathematically the curve is concave to the origin. It curves around the point given by zero production of both goods. This is because of the law of diminishing returns. Movements from A to B to C each involve the transfer of factors of production from the good Y industry to the good X industry. The production possibility frontier (PPF) shows the point at which society is producing efficiently (we must also to say that to be fully efficient, a resource allocation must not only be productively efficient but also must make the combination of goods that consumers most want).Given that people like (or needs) goods X and Y; society should want produce efficiently, so the problem is to make a choice between the different points that lie on the PPF. In this way they decides what to produce, they can choice only good Y (40 units) and not good X (zero units),the opposite situation zero units of good Y and 15 units of good X or they can choice the point D, with a balanced mixture of Both goods ( 9 units of X and 25 of Y). Depending on society's preference.
C) THE
The opportunity costs is the value of the good forgone. In each combination making a chose in effect costs us the opportunity to do something else. I can find the opportunity costs for each combination subtrahend to the total output the output product in each combination both goods X and goods Y.
COMBINATION A:
The opportunity cost of good X is: 15
The opportunity cost of good Y is: 0
COMBINATION B:
The opportunity cost of good X is: 12
The opportunity cost of good Y is: 2
COMBINATION C:
The opportunity cost of good X is: 9
The opportunity cost of good Y is: 7
COMBINATION D:
The opportunity cost of good X is: 6
The opportunity cost of good Y is: 15
COMBINATION E:
The opportunity cost of good X is: 3
The opportunity cost of good Y is: 26
COMBINATION F:
The opportunity cost of good X is: 0
The opportunity cost of good Y is: 40
D) WHAT IT HAPPENS WHEN THE ECONOMY PRODUCES
6 UNITS OF GOOD X AND 25 UNIT OF GOODY
Now we know what is the PPF curve. Our curve touches different points from A to F. We also could individuates others different points, in our particular case we can individuate point "H" as shown in the figure below:
The point H has the following combination:( 6 units of good X and 25 units of good Y)
This is a feasible combination. In this case our first supposition ( the economy has the factors of production fully and efficiently used) is not valid. In fact with this combination of good X and good Y we can suppose that same factor of production is not fully used, for example we can suppose that same potential worker is not employed. H is not a point on the PPF because it is possible to produce more of one good (for ex. Y), without sacrificing output of other good (good X). Putting the extra workers to work in the good Y industry would take us to the point C ,yielding 8 extra units of good Y for the same X output. Putting the extra workers to work in the good X industry would take us to the point D, with 3 extra units of good X but no loss of good Y output.
We can say that point such as "H", which lie inside the frontier, are "inefficient" because society is wasting resources. More output of one good would no require less output of the other, in our hypothetical example the inefficiency arises because some potential workers are not being used to produced goods.
The points G (10,35) as we can se in the figure below lie outside the production possibility frontier, such kind of points are said to be "unattainable". In fact it would be nice to have even more good X and good Y but, with the given amount of factor of production it is impossible to produce this output combination. Scarcity of resources limits society to a choice of points that lie inside or on the PPF.
Figure
Considering the quantity of factors of production we can decide to maintain stationary the output quantity of good X and reducing the output quantity of good Y, or we can do the opposite ( output of Y stationary and less quantity of X).
Starting from the combination G (10,35) if we decide to maintain the level production of good X at level 10 units, it will be necessary to decrease the good Y production as far as 22,34 units, in fact 10 units of good X are only 1 unit more than 9 units, when we produce 9 units of good X we also can produce 25 units of good Y (as we an see in the combination "D"). So an increase in output quantity of good X of 1 unit, lead us to a decrease in output quantity of good Y from 25 units to (as I already said) 22,34 units.
It is possible to get this number making the following calculus:
Y / X = 40/15 = 2,66
2,66 * 1 (number of unit more that combination G asks of good X instead the combination "D" asks) = 2,66
25 - 2,66 = 22,34 (quantity of output that it is possible to produce of good Y if the quantity of X is 10 units).
In the same way if we wants maintain the level of production of good Y that the combination "G" asks (10,35) we understand that to obtain 35 units of good Y it is necessary to increase the production of good Y of 2 units ( starting from combination "C" (6,33)).
Obviously an increase of this quantity (from 33 to 35 units of Y) will lead us to decrease in output quantity of good X from 6 units to 5,25 units.
It is possible to get this number making the following calculus:
X / Y = 15/40 = 0,375
0,375 * 2 ( number of units more that the combination "G" asks of good Y instead the combination "C" ) = 0,75
6 - 0,75 = 5,25 (quantity of output that it is possible to produce of good X if the quantity of Y is 35 units).
|
Privacy |
Articolo informazione
Commentare questo articolo:Non sei registratoDevi essere registrato per commentare ISCRIVITI |
Copiare il codice nella pagina web del tuo sito. |
Copyright InfTub.com 2025